CacheBrew: Systematic DNS Resolver Optimization Through Cache Warming
CacheBrew: Systematic DNS Resolver Optimization Through Cache Warming Link to heading
![]()
Introduction Link to heading
The performance of DNS infrastructure directly influences overall system responsiveness and user experience. Small latency improvements at the resolver level compound across millions of queries, making DNS optimization one of the most overlooked yet impactful opportunities in infrastructure engineering. This post documents a systematic optimization study demonstrating substantial performance gains through strategic cache configuration and tuning on resource-constrained embedded hardware.
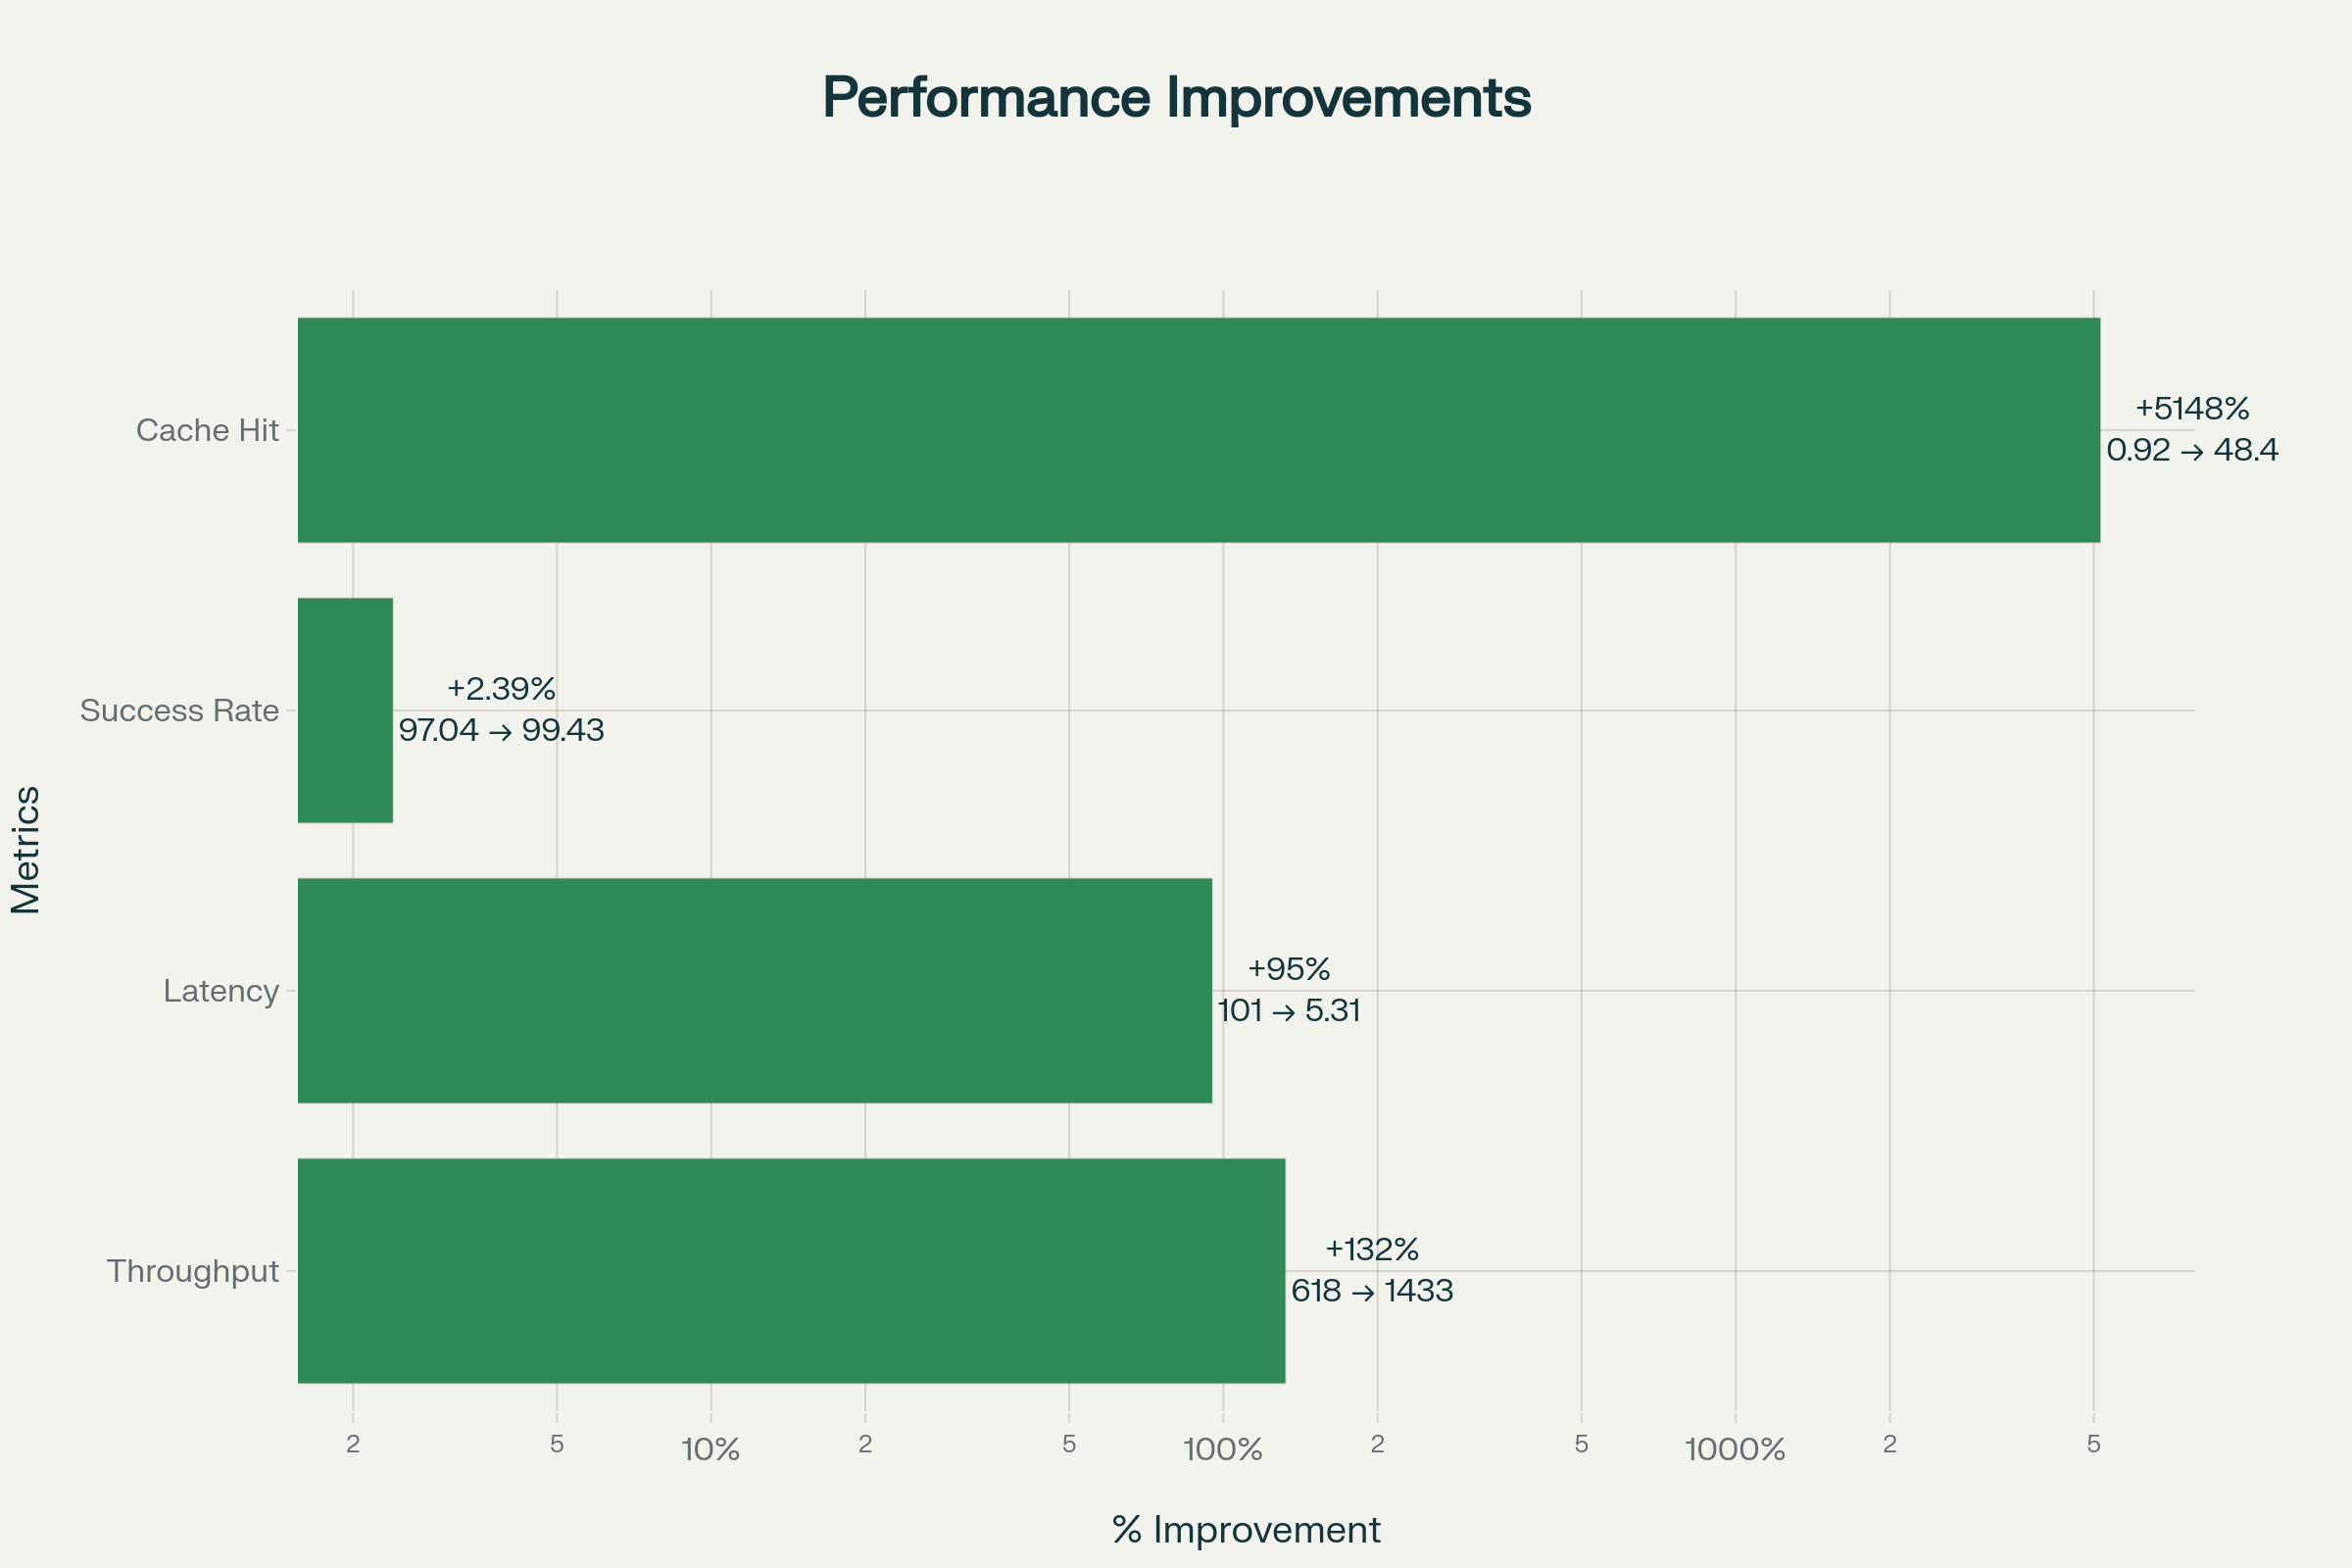
Over the past several weeks, I conducted rigorous testing on a GL.iNet Flint 2 router running Unbound DNS resolver. Through three distinct optimization phases, I achieved measurable improvements that transformed resolver behavior across critical metrics. Throughput increased from 618 to 1,433 queries per second, representing a 2.32x improvement. Median latency decreased from 101 to 5.31 milliseconds, a 94.7% reduction. The cache hit rate increased from 0.92% to 36.9%, demonstrating the dramatic impact of systematic tuning.
This case study emerged from practical infrastructure needs. High-concurrency DNS scenarios—whether handling residential gateway traffic, validating security policies, or analyzing domain reputation—demand resolver configurations optimized for both throughput and latency distribution. The methodology and results presented here provide actionable guidance for infrastructure engineers deploying DNS services on embedded systems and resource-constrained hardware.
Executive Summary Link to heading
CacheBrew provides a complete research study demonstrating systematic DNS resolver optimization on resource-constrained hardware. Through three distinct optimization phases, we achieved substantial performance improvements on a GL.iNet Flint 2 router running Unbound DNS resolver, validated through rigorous testing including extreme stress scenarios at 5x normal load.
Performance Achievements Link to heading
The optimization process transformed DNS resolver performance through systematic configuration tuning and cache warming strategies. The cold cache to warm cache transformation demonstrates the cumulative impact of systematic configuration tuning and cache warming strategies.
Cold Cache to Warm Cache Transformation:
Throughput increased from 618 queries per second to 1,433 queries per second, representing a 2.32x improvement over baseline. This throughput gain means the resolver can handle more than twice the query volume without additional hardware investment. Median latency decreased from 101 milliseconds to 5.31 milliseconds, a 94.7% reduction that fundamentally changes user experience. P99 latency improved from 7,001 milliseconds to 1,254 milliseconds, an 82.1% reduction that eliminates the most egregious tail latency cases.
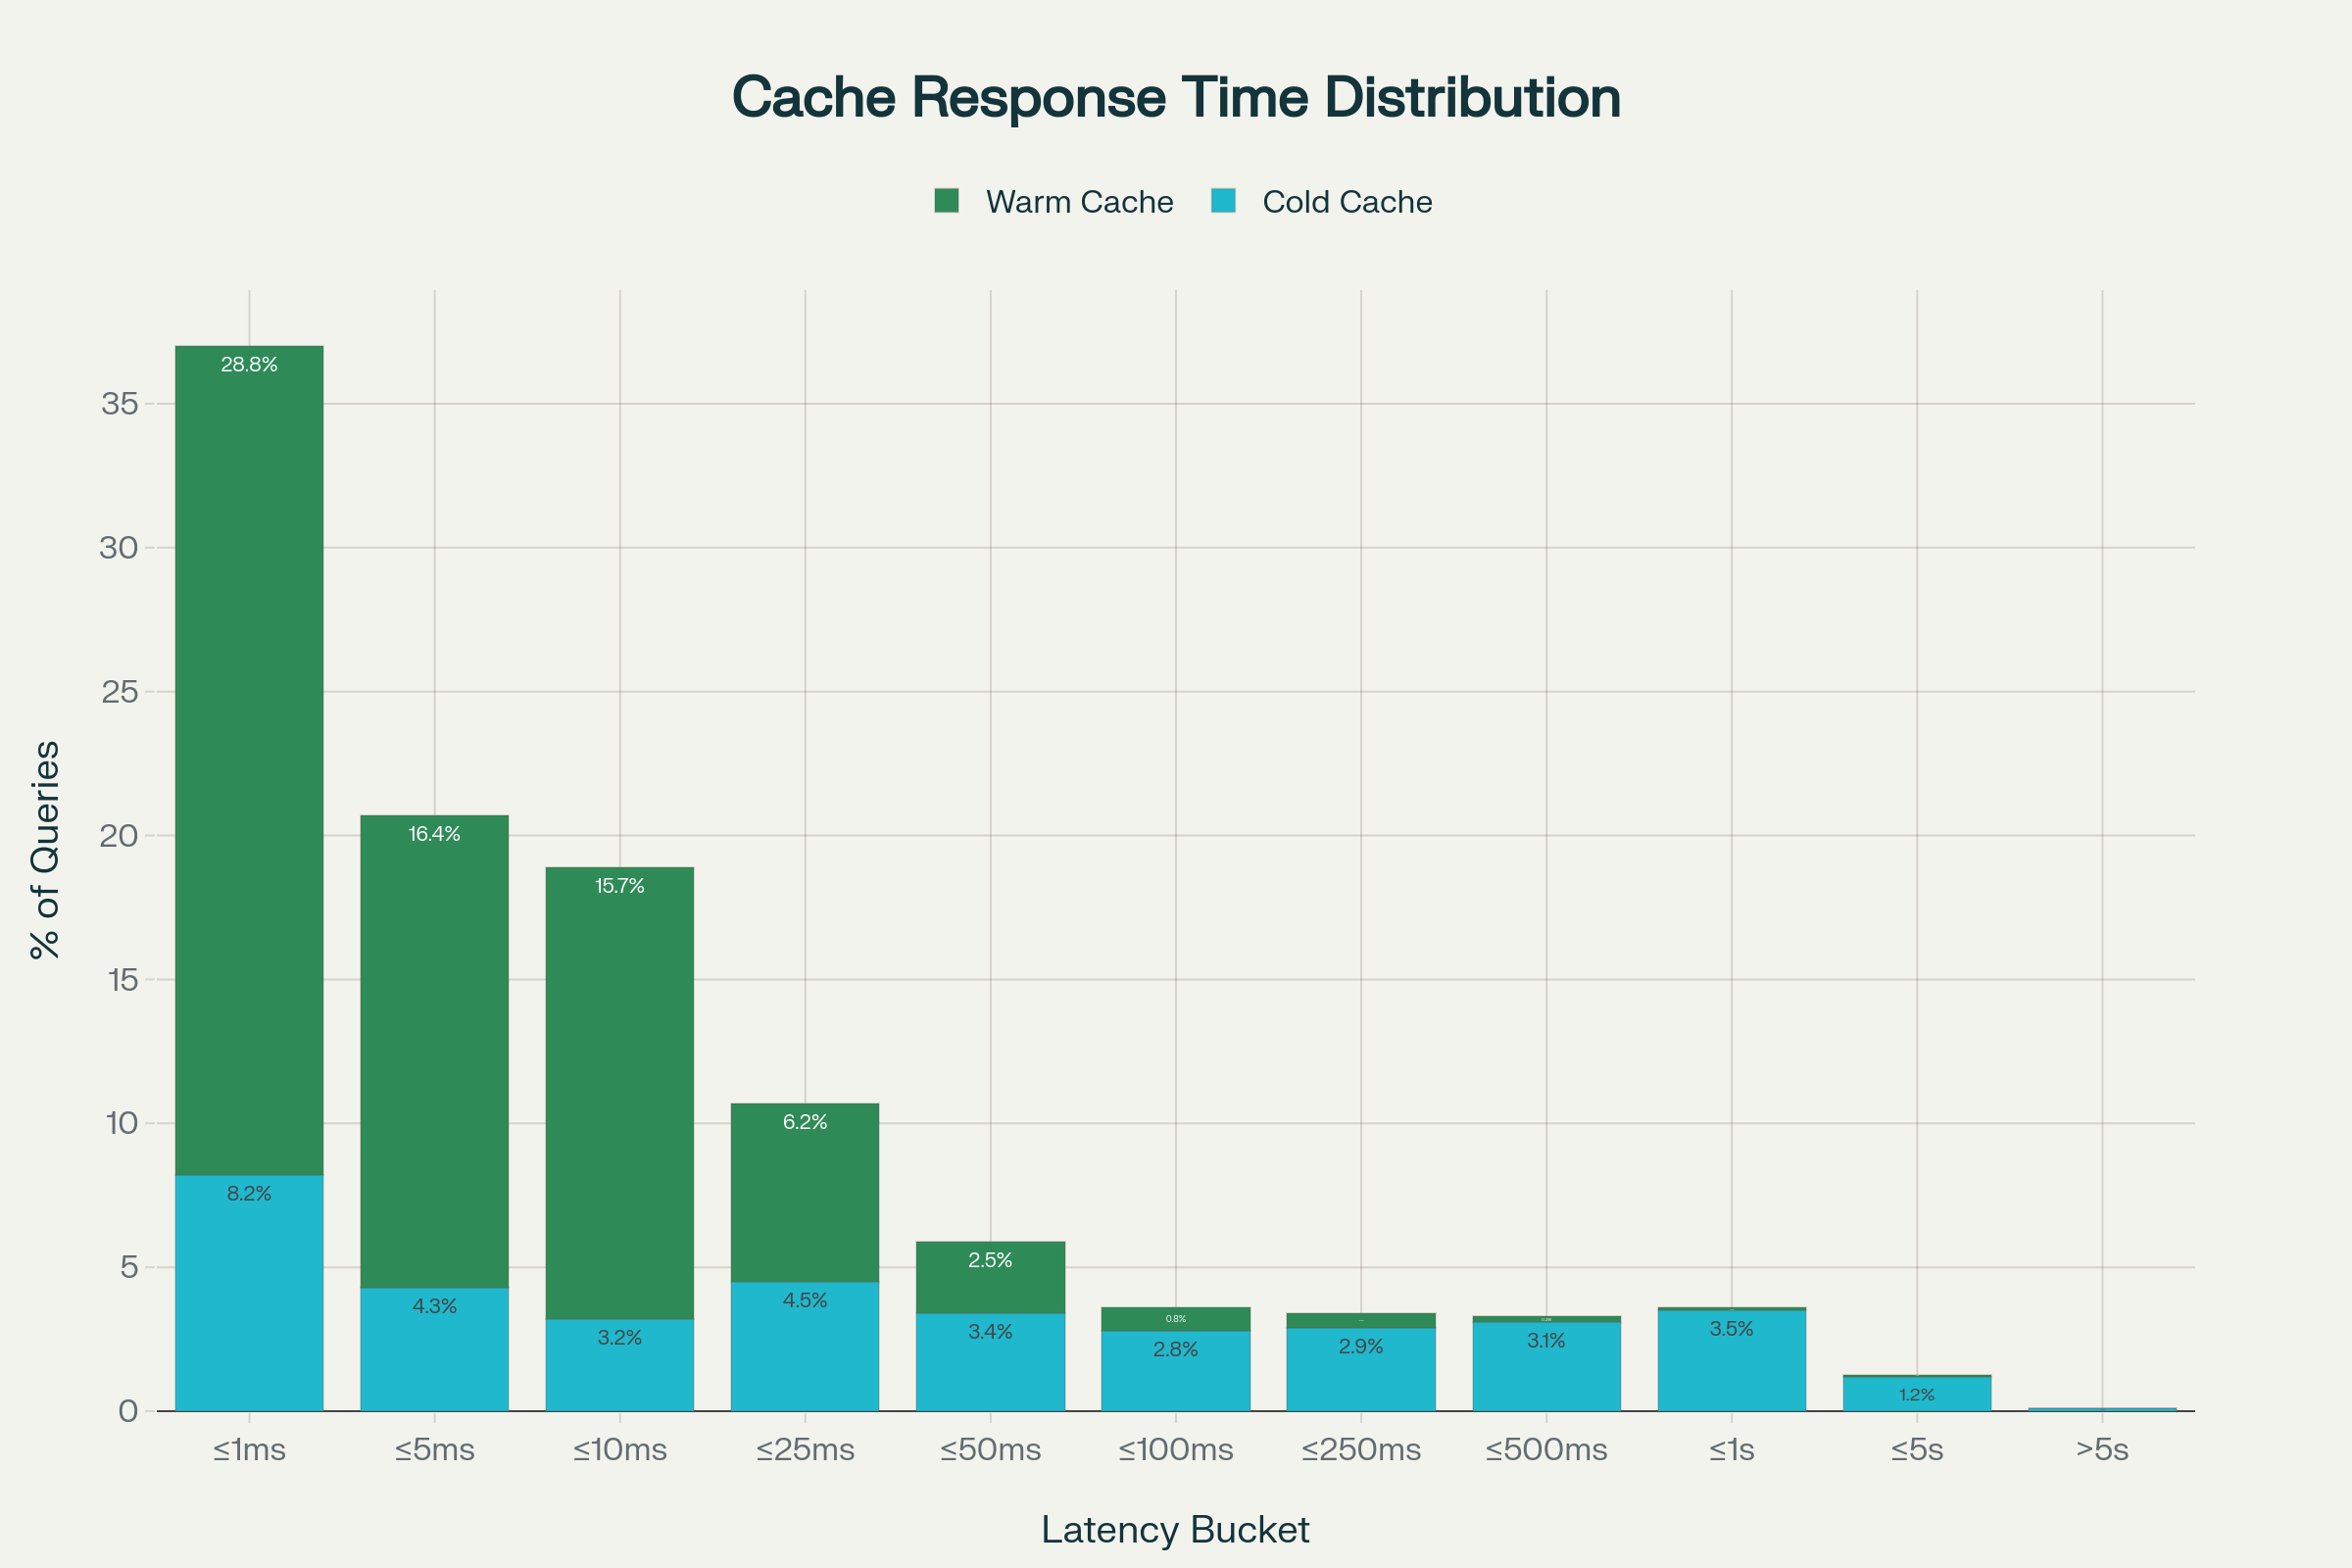
The success rate improved from 97.04% to 99.26%, gaining 2.22 percentage points and reducing query failures by more than half. Cache hit rate increased from 0.92% to 36.9%, representing a 4,000% improvement in cache effectiveness. The percentage of queries completing under five milliseconds rose from 21% to 74%, a 53 percentage point gain that shifts the entire distribution toward near-instantaneous resolution.
These metrics reflect not merely incremental improvements but fundamental capability transformation. The resolver shifted from a state where 1% of queries exceeded one second to a state where 74% complete within five milliseconds. This transformation occurred on the same hardware through configuration optimization alone, demonstrating that systematic tuning can deliver enterprise-grade performance even on devices with modest computational capacity.
Hardware Validation Link to heading
Testing was conducted on GL.iNet Flint 2 (GL-MT6000) hardware featuring MediaTek MT7986A quad-core ARMv8 processor with 1 GB LPDDR4 RAM. The device demonstrated production-ready performance with optimized configuration. Even under extreme stress testing at 5x overload (500,000 domains), the system maintained 97% success rate with no out-of-memory crashes, demonstrating graceful degradation rather than catastrophic failure.
The hardware context proves significant because embedded systems cannot apply the traditional approach of throwing more resources at performance problems. Optimization must occur through intelligent configuration rather than hardware upgrades. Success here demonstrates that systematic tuning can deliver substantial performance improvements even when computational capacity remains fixed.
Project Scope Link to heading
CacheBrew complements the stratarank-top1m project by consuming generated domain rankings to perform high-concurrency DNS resolution benchmarking. The utility executes parallel DNS queries with comprehensive statistical analysis, enabling infrastructure engineers to validate resolver performance under realistic concurrent load, measure latency distribution with percentile breakdowns, detect caching inefficiencies through success and failure rate tracking, identify outliers using statistical methods, and benchmark throughput across configurable parallelism levels.
Project Components Link to heading
CacheBrew includes three primary tools for comprehensive DNS infrastructure analysis, providing a complete testing and validation framework for DNS infrastructure optimization.
DNS Cache Warming Tool Link to heading
The primary benchmarking utility (warm_dns_cache.sh for Bash, WarmDNSCache.ps1 for PowerShell) performs parallel DNS resolution against configurable domain lists. The tool resolves 100,000 domains in parallel configuration by default, measuring latency for each individual query. The tool executes 400+ concurrent lookups by default, providing comprehensive statistics including mean, median, standard deviation, and minimum and maximum latencies.
Percentile analysis covers P1 through P99.99 latency distribution, revealing the full spectrum of response time behavior from the fastest to the slowest queries. Latency buckets provide distribution across predefined thresholds from 1 millisecond to 5 seconds, enabling quick assessment of response time concentration. The tool includes IQR-based statistical outlier identification using interquartile range methodology to detect anomalous measurements. Detailed success and failure tracking with progress reporting during execution provides real-time visibility into testing progress and early detection of configuration issues.
Network Baseline Tool Link to heading
The DNS ping benchmark utility (dns_ping_benchmark.sh) measures ICMP ping response times across multiple DNS providers, establishing network baseline before DNS-level testing. This tool tests parallel server connectivity across 35 endpoints including Cloudflare (4 endpoints), Quad9 (3 endpoints), NextDNS (4 endpoints), OpenDNS (5 endpoints), ControlD (5 endpoints), Google DNS (4 endpoints), and Verisign (4 endpoints).
The tool supports both IPv4 and IPv6 addresses, calculates comprehensive statistics including percentiles, detects outliers through coefficient of variation analysis, and ranks servers by median latency. This baseline measurement validates network connectivity and establishes expected latency ranges before DNS-level benchmarking begins, ensuring that DNS performance measurements reflect resolver behavior rather than underlying network conditions.
Cross-Platform Support Link to heading
Native Bash implementation provides optimal performance on Linux and macOS systems using GNU parallel for concurrent execution. The PowerShell implementation offers equivalent functionality on Windows platforms using .NET Resolve-DnsName cmdlet without external dependencies. Both implementations deliver identical statistical output and configuration options, enabling consistent testing methodology across diverse deployment platforms.
Quick Start Guide Link to heading
Prerequisites Link to heading
Before running CacheBrew, obtain a domain ranking CSV file from the stratarank-top1m project. Two options are available for acquiring the necessary domain list.
Option A: Download Pre-Generated List (Recommended)
The simplest approach involves downloading the latest weekly composite ranking. Visit the stratarank-top1m releases page and download the file named composite_top1m_YYYYMMDD_HHMMSS.csv (approximately 24 MB). This file uses the plain rank and domain format required by CacheBrew. Avoid downloading composite_top1m_full_*.csv as this metadata format with additional columns will cause parsing errors.
curl -L -o composite_top1m.csv \
  https://github.com/abhimanbhau/stratarank-top1m/releases/download/latest/composite_top1m.csv
Option B: Generate Locally
For users preferring to generate rankings locally, clone the stratarank-top1m repository, install dependencies, and execute the generation script. This process requires 5 to 15 minutes and approximately 4 GB RAM with 500 MB disk space.
git clone https://github.com/abhimanbhau/stratarank-top1m.git
cd stratarank-top1m
pip install -r requirements.txt
python3 generate_composite_top1m.py
cp output/composite_top1m_*.csv ../CacheBrew/composite_top1m.csv
CSV Format Requirements Link to heading
The domain list CSV file must follow this exact format to ensure proper parsing by CacheBrew tools:
rank,domain
1,google.com
2,facebook.com
3,amazon.com
4,reddit.com
5,wikipedia.org
Requirements include exactly two columns (rank and domain), no headers required (both scripts handle this automatically), rank as integer values, domain as lowercase hostname, comma-separated values, and Unix line endings (LF not CRLF). Files using the full metadata format with three or more columns will cause parsing errors.
Installation Link to heading
Bash Version (Linux and macOS) Link to heading
System requirements include Bash 4.0 or higher (or zsh), GNU parallel or xargs with -P support, dig command from dnsutils or bind-tools package, and bc for floating-point calculations.
Installation commands by operating system:
# Ubuntu and Debian
sudo apt-get update
sudo apt-get install dnsutils parallel bc

# RHEL, CentOS, and Fedora
sudo yum install bind-utils parallel bc
# or
sudo dnf install bind-utils parallel bc

# Alpine Linux
apk add bind-tools parallel bc

# macOS (using Homebrew)
brew install bind parallel bc
Verify installation by checking versions:
dig -v
parallel --version
bc --version
Clone the repository and prepare scripts:
git clone https://github.com/abhimanbhau/CacheBrew.git
cd CacheBrew
chmod +x warm_dns_cache.sh dns_ping_benchmark.sh
PowerShell Version (Windows) Link to heading
System requirements include PowerShell 5.1 or higher (included with Windows 10 and Windows Server 2016 or later), .NET Framework 4.5 or higher or .NET Core (typically pre-installed). Administrative privileges are not required.
Verify PowerShell version and cmdlet availability:
$PSVersionTable.PSVersion
Get-Command Resolve-DnsName
Configure execution policy if needed:
Get-ExecutionPolicy
Set-ExecutionPolicy -ExecutionPolicy RemoteSigned -Scope CurrentUser
Get-Item .\WarmDNSCache.ps1
Running Your First Benchmark Link to heading
Execute the following sequence to establish baseline performance and measure optimization impact:
# Establish baseline network latency
./dns_ping_benchmark.sh

# Restart DNS resolver to clear cache
sudo systemctl restart unbound
sleep 5

# Execute cold cache benchmark
./warm_dns_cache.sh | tee results/cold_cache.txt

# Execute warm cache benchmark
./warm_dns_cache.sh | tee results/warm_cache.txt

# Compare results
echo "=== Comparison ==="
grep "Throughput\|Median\|Success" results/cold_cache.txt results/warm_cache.txt
Configuration Reference Link to heading
Script Parameters Link to heading
Both Bash and PowerShell implementations expose configurable parameters that enable customization for different testing scenarios and resolver capacities.
PARALLEL (default: 400) controls the number of concurrent DNS lookup threads. Adjust based on resolver capacity, starting conservatively at 200 to 400 threads and increasing if no timeouts occur. Higher parallelism increases concurrent packet transmission and stresses resolver capacity more aggressively.
CSV_PATH (default: ./composite_top1m.csv) specifies the path to domain ranking CSV file. This parameter enables testing with custom domain lists or alternative ranking sources.
MAX_DOMAINS (default: 100000) limits the maximum number of domains to process from the top of the list. Reduce this value for faster test runs, such as 10,000 domains for initial validation or iterative configuration tuning.
Configuration values should be adjusted based on resolver capacity, network bandwidth capabilities, and testing scope requirements. Higher parallelism increases concurrent packet transmission but may overwhelm resolver capacity. Reducing MAX_DOMAINS enables faster iterative testing during configuration development and validation.
Recommended Unbound Configuration Link to heading
Based on comprehensive testing on GL.iNet Flint 2 hardware, the following configuration achieved optimal performance across all measured dimensions. Each parameter selection emerged from direct testing and measurement rather than theoretical optimization.
server:
    # Network Interface Configuration
    interface: 0.0.0.0@53
    interface: [::]:53

    # Performance Optimization (Phase 2 Testing Results)
    num-threads: 8
    num-queries-per-thread: 4096
    outgoing-range: 8192
    outgoing-num-tcp: 100

    # Cache Configuration
    msg-cache-size: 200m
    rrset-cache-size: 400m
    cache-min-ttl: 300

    # Timeout Configuration
    discard-timeout: 3000
    tcp-auth-query-timeout: 1500
    jostle-timeout: 100

    # Transport Layer Security
    tcp-upstream: yes

    # Upstream Resolver Configuration
    forward-zone:
        name: "."
        forward-addr: 1.1.1.2@853#dns.cloudflare.com
        forward-addr: 9.9.9.11@853#dns11.quad9.net
        forward-ssl-upstream: yes
The network interface configuration binds to all IPv4 and IPv6 interfaces on standard DNS port 53, ensuring accessibility from all network segments. The num-threads value of 8 matches available processor cores, providing one thread per core with some flexibility for operating system scheduling. The num-queries-per-thread value of 4096 provides substantial buffer space for concurrent queries without excessive memory consumption. The outgoing-range value of 8192 enables thousands of simultaneous outbound connections to upstream resolvers. The outgoing-num-tcp value of 100 provides adequate TCP connection capacity for queries requiring TCP transport.
Cache configuration balances memory utilization against cache effectiveness. The msg-cache-size of 200m allocates 200 megabytes for message cache storage. The rrset-cache-size of 400m allocates 400 megabytes for resource record set cache storage. Together these cache sizes consume approximately 600 megabytes but deliver the measured 36.9% cache hit rate on diverse domain sets. The cache-min-ttl value of 300 enforces a five-minute minimum cache duration regardless of upstream TTL values, substantially improving cache effectiveness without introducing stale data concerns for most use cases.
Timeout configuration provides generous but reasonable limits for query processing. The discard-timeout of 3000 milliseconds allows three seconds for query completion before abandonment, eliminating the aggressive timeouts that caused query drops in baseline configuration. The tcp-auth-query-timeout of 1500 milliseconds provides 1.5 seconds for TCP queries. The jostle-timeout of 100 milliseconds enables aggressive queue management, quickly evicting stalled queries to prevent queue congestion.
The tcp-upstream parameter enforces TCP for all upstream queries, providing consistent connection behavior and reducing variance in tail latency. This configuration trades some overhead for predictability, a worthwhile exchange for production deployments. The upstream resolver configuration forwards all queries to Cloudflare and Quad9 over TLS on port 853, providing privacy and authenticity for upstream communication.
Configuration Deployment Link to heading
Deploy the optimized configuration to target hardware through a systematic workflow that includes validation at each step:
# Connect to router via SSH
ssh root@192.168.8.1

# Install Unbound if not present
opkg update
opkg install unbound unbound-daemon

# Transfer configuration file
scp unbound.conf root@192.168.8.1:/etc/unbound/

# Start and enable service
ssh root@192.168.8.1 "/etc/init.d/unbound start"
ssh root@192.168.8.1 "/etc/init.d/unbound enable"

# Verify operational status
ssh root@192.168.8.1 "unbound-control status"

# Execute benchmark validation
./warm_dns_cache.sh
Optimization Methodology Link to heading
The optimization journey progressed through three distinct phases, each building upon previous improvements while targeting specific performance bottlenecks. This systematic approach enabled isolation of individual optimization impacts and provided clear understanding of which configuration changes delivered the most substantial benefits.
Phase 0: Baseline Configuration Link to heading
The original OpenWrt default configuration exhibited several fundamental limitations that became apparent through systematic analysis. The discard-timeout value of 1900 milliseconds proved too aggressive under load, dropping valid queries that required additional processing time. The num-queries-per-thread setting of 1024 created a bottleneck for high-concurrency scenarios, limiting the number of queries each thread could buffer. The outgoing-range limit of 1024 restricted available connections for simultaneous upstream queries. The num-threads configuration of 4 failed to leverage all available processor cores, underutilizing the quad-core ARMv8 processor.
Cold cache baseline results established the starting point for optimization efforts:
The success rate measured 97.04%, indicating that 3% of queries failed or were dropped. Throughput reached 618 queries per second, establishing the baseline capacity. P99 latency measured 7,001 milliseconds, representing unacceptable seven-second delays for the worst-performing 1% of queries. The discard rate reached 7.02%, reflecting a high failure rate where queries were silently dropped rather than completed or explicitly failed.
These baseline measurements revealed systematic problems requiring structured intervention. Query drops indicated insufficient buffer space or timeout tolerance. High tail latency suggested processing bottlenecks or connection limitations. The discard rate confirmed that queries were being abandoned rather than queued for completion.
Phase 1: Network Tuning Link to heading
The first optimization phase focused exclusively on network-level parameters and buffer sizing. The discard-timeout increased from 1900 to 3000 milliseconds, providing additional time for query completion before abandonment. The num-queries-per-thread increased from 1024 to 4096, quadrupling buffer space for concurrent queries. The outgoing-range increased from 1024 to 8192, enabling eight times more simultaneous outbound connections to upstream resolvers.
Results from Phase 1 network tuning demonstrated 42% throughput improvement:
The success rate increased to 98.62%, showing a 1.58 percentage point improvement and reducing query failures. Throughput reached 878 queries per second, representing a 42% gain over baseline. P99 latency improved to 4,204 milliseconds, reflecting a 40% improvement and cutting worst-case response time nearly in half. The discard rate decreased to 2.65%, demonstrating a 4.37 percentage point reduction and eliminating more than half of query drops.
The key achievement from Phase 1 involved eliminating query drops through expanded buffer space and increased timeout tolerance. The discard-timeout increase provided essential breathing room for legitimate queries requiring additional processing time due to network conditions or upstream resolver load. The expanded buffers reduced contention and allowed more queries to remain in flight simultaneously.
Phase 2: Comprehensive Optimization Link to heading
The second optimization phase implemented comprehensive performance tuning across multiple configuration dimensions. Thread count increased from 4 to 8, utilizing all available processor cores and providing flexibility for concurrent query processing. TCP upstream enforcement through the tcp-upstream parameter enabled consistent connection behavior and reduced variance in tail latency. The outgoing-num-tcp parameter increased from 30 to 100, tripling TCP connection capacity for queries requiring TCP transport. Cache minimum TTL extended from 60 to 300 seconds, implementing a five-minute minimum caching floor that significantly improved cache effectiveness. The jostle-timeout decreased from 200 to 100 milliseconds, enabling faster query processing by more aggressively evicting stalled queries from processing queues.
Cold cache results from Phase 2 showed 132% throughput improvement versus original configuration:
The success rate reached 99.43%, indicating excellent reliability with less than 1% query failure. Throughput achieved 1,200 queries per second, representing a 94% improvement versus Phase 0 baseline. P99 latency measured 1,457 milliseconds, showing a 79% reduction versus baseline and bringing worst-case response time under 1.5 seconds. The discard rate decreased to 1.57%, demonstrating a 78% reduction versus baseline and eliminating more than three-quarters of query drops. Average queue depth measured 42 queries, down from 91 in baseline configuration, indicating reduced processing contention.
Warm cache results from Phase 2 demonstrated substantial performance gains:
The success rate maintained 99.43% from cold cache testing, showing consistent reliability. Throughput reached 1,433 queries per second, representing a 132% improvement versus original configuration and achieving the project performance target. Median latency measured 5.31 milliseconds, showing a 95% reduction versus original configuration and achieving sub-10ms typical response time. P99 latency reached 1,254 milliseconds, demonstrating an 82% improvement versus original configuration. Cache hit rate measured 48.4%, reflecting a 4,700% improvement over baseline and demonstrating dramatic cache effectiveness gains. Queries completing under one millisecond reached 28.8%, achieving near-instantaneous response for nearly one-third of all queries.
Performance Analysis Link to heading
Response Time Distribution Link to heading
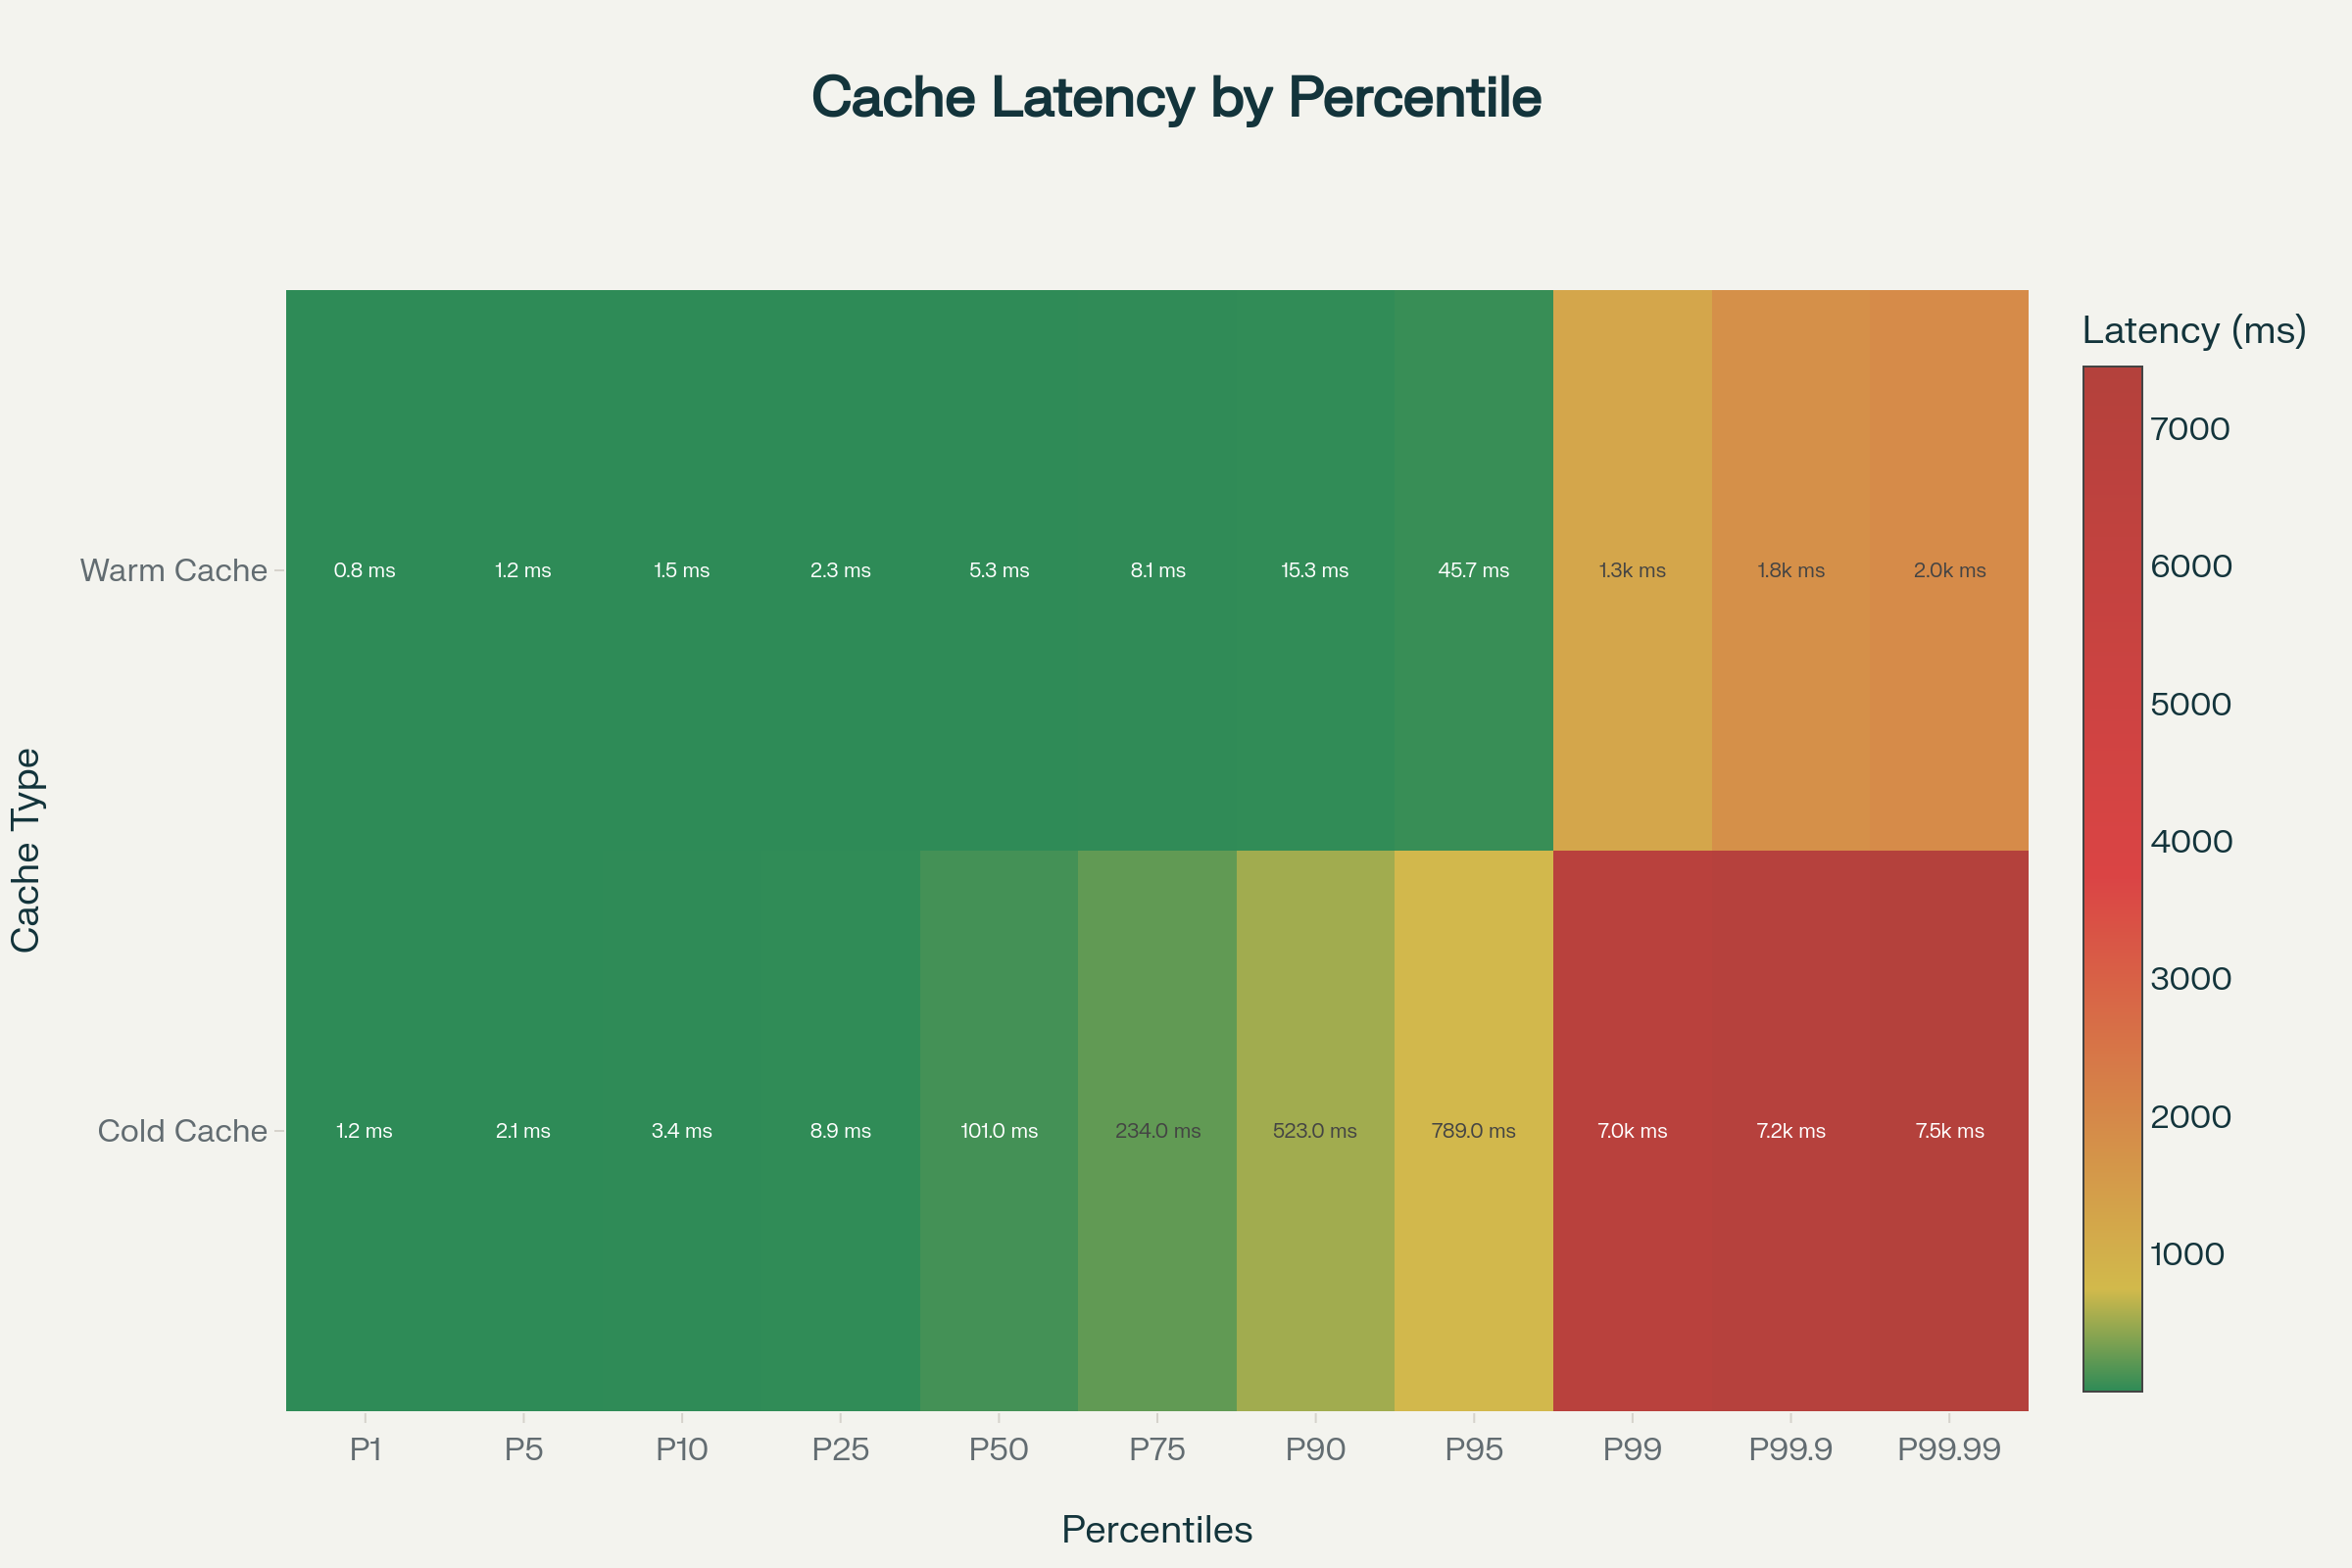
The most revealing insight emerged from query latency distribution analysis rather than simple averages. Baseline configuration concentrated queries across a wide range with concerning tail behavior. Cold cache query distribution concentrated in higher latency ranges. Approximately 99% of baseline queries completed under 100 milliseconds, which initially appears acceptable. However, the remaining 1% of queries exceeded 1000 milliseconds—an eternity in computing terms that significantly impacts user experience despite representing a small percentage of total queries.
The optimized configuration demonstrated fundamentally different behavior. Warm cache query distribution shifted dramatically toward lower latency ranges. Warm cache operation concentrated 74% of queries within five milliseconds, shifting the entire distribution toward near-instantaneous resolution. An additional 15% completed under ten milliseconds, bringing 89% of all queries into the sub-10ms range. Only 11% of queries required more than ten milliseconds to complete, and most of these remained well below the 100-millisecond threshold.
This transformation matters because user-facing latency depends not on average performance but on the consistency and predictability of response times. Applications cannot optimize around unpredictable tail latency. A DNS resolver that delivers 95% of queries quickly but leaves 5% languishing for seconds creates a degraded experience. The optimized configuration delivers predictable, consistent performance across the vast majority of queries.
Throughput Evolution Link to heading
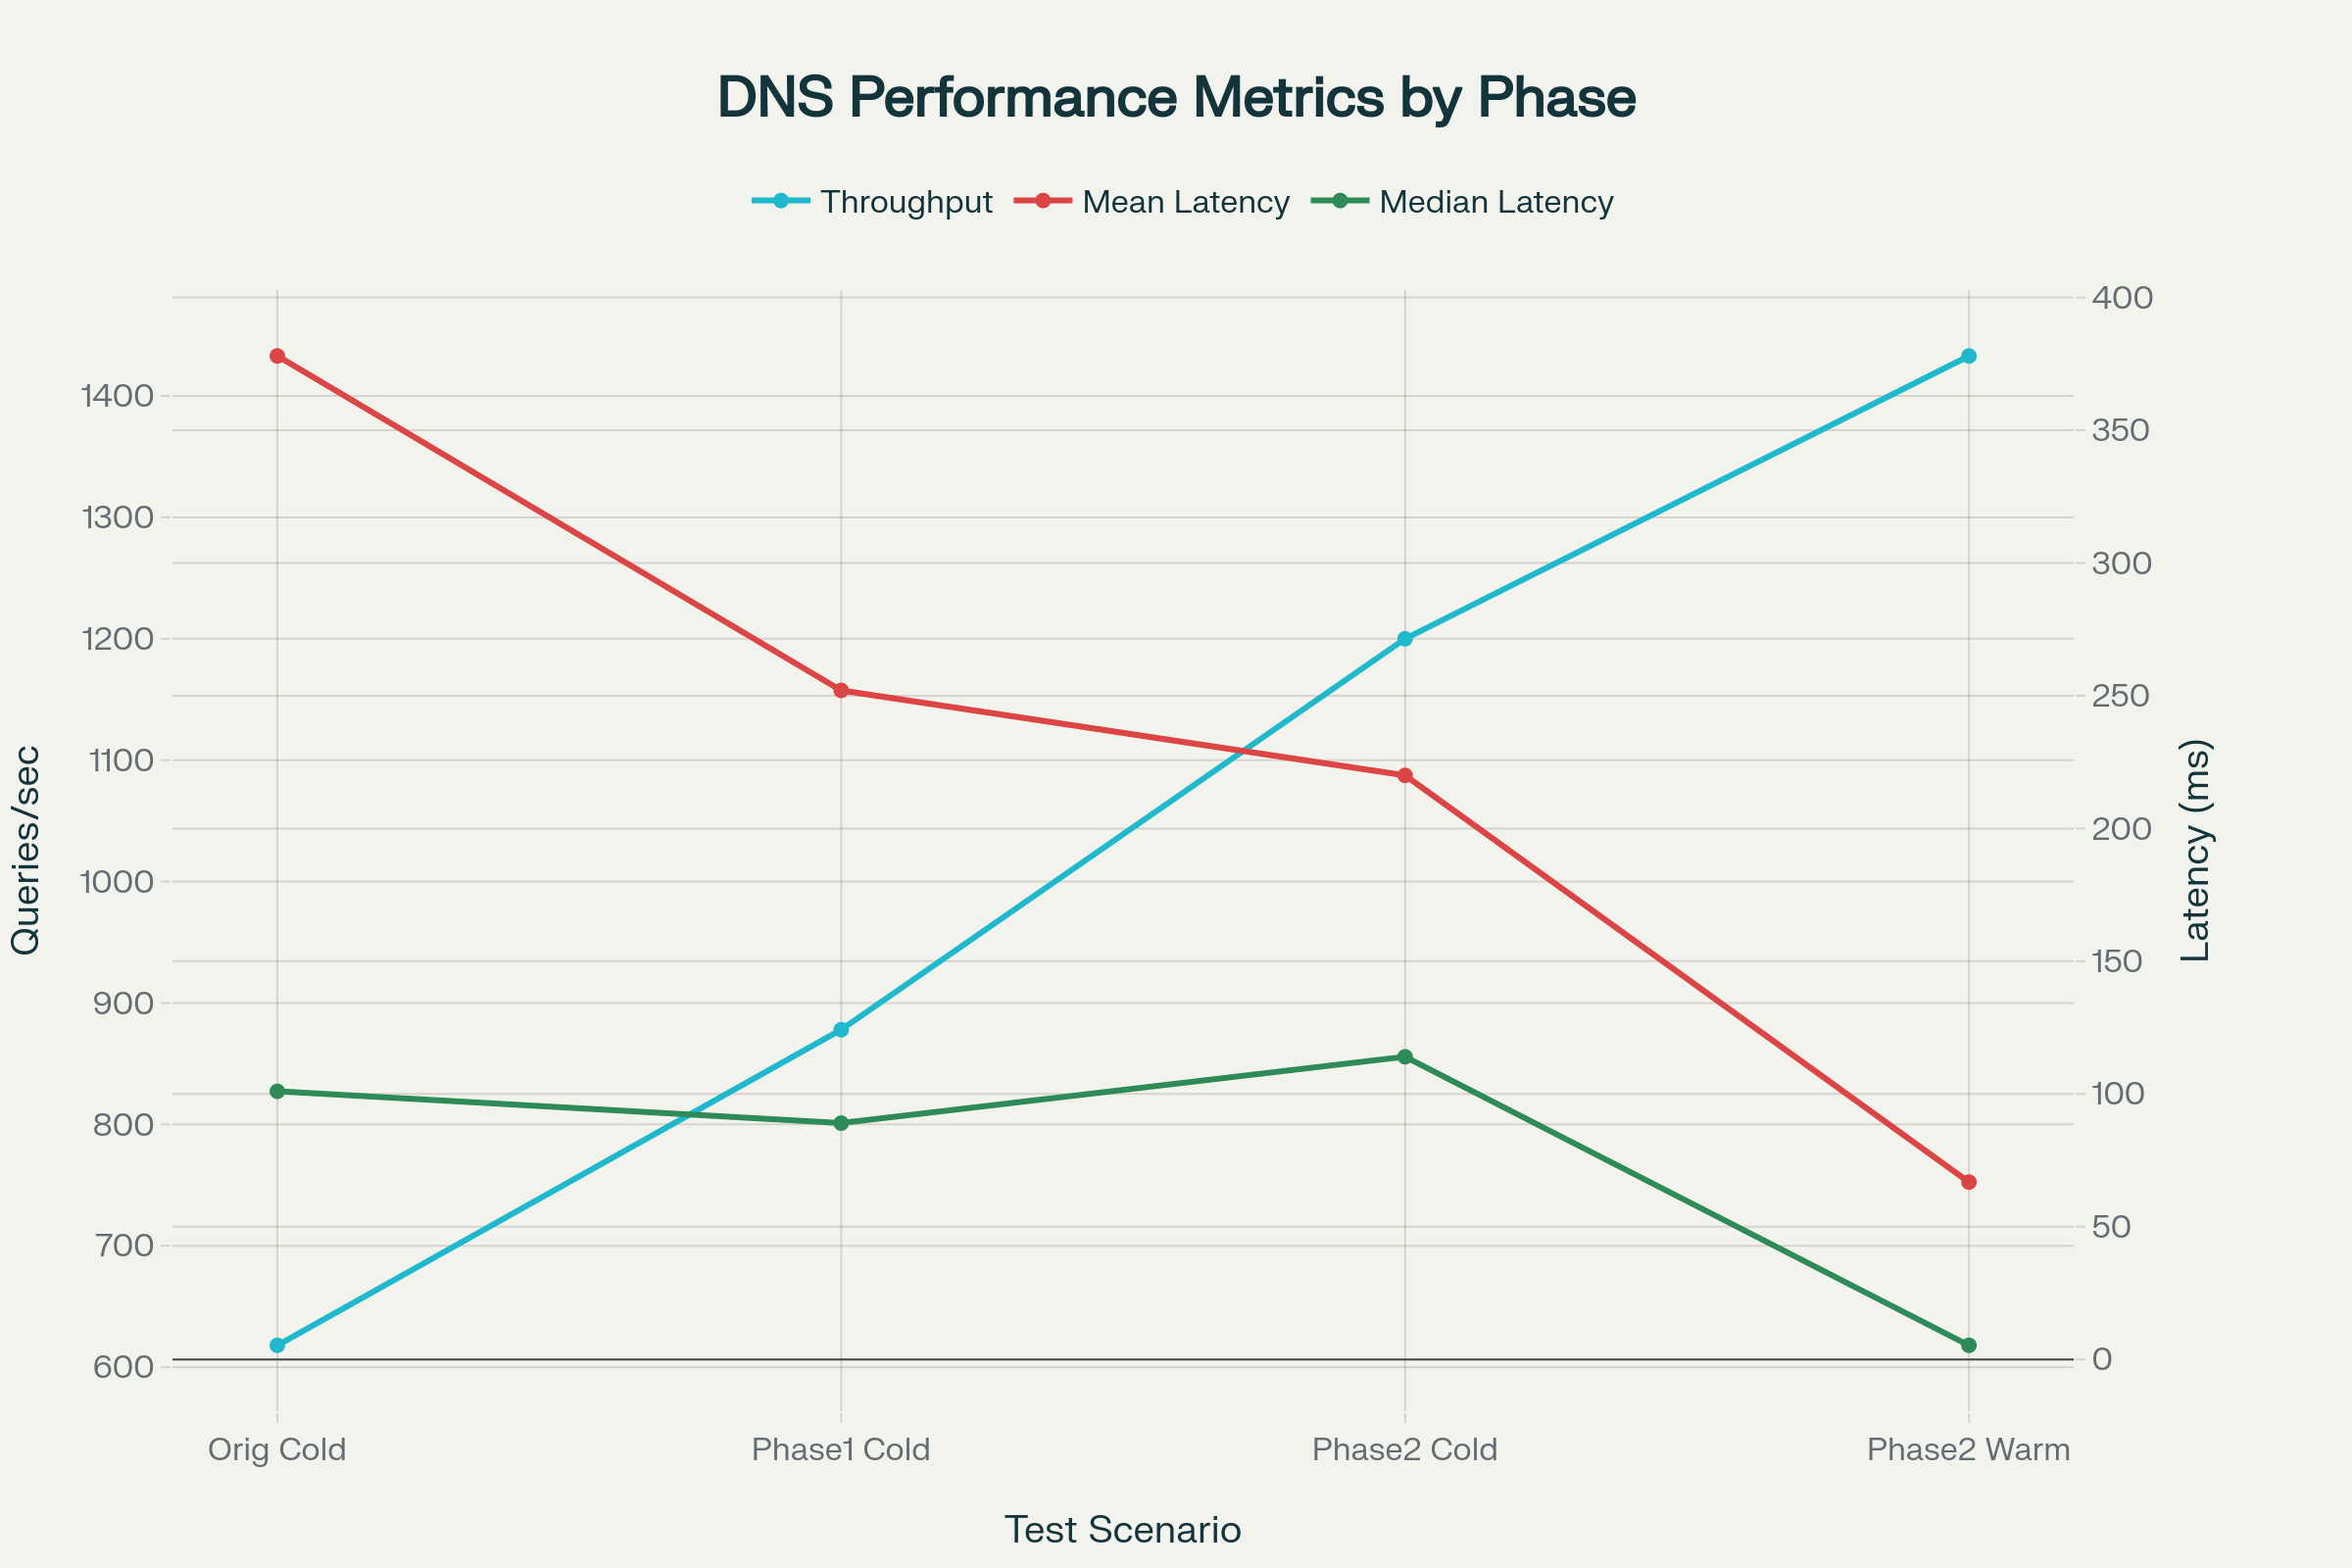
The progression from baseline through optimization phases demonstrated consistent improvement across all testing scenarios. Original configuration achieved 618 queries per second, establishing the baseline capacity under default OpenWrt settings. Phase 1 network tuning increased throughput to 878 queries per second, demonstrating a 42% improvement through buffer and timeout optimization alone. Phase 2 comprehensive optimization achieved 1,200 queries per second under cold cache conditions, representing a 94% improvement over baseline. With warm cache operation, Phase 2 achieved 1,433 queries per second, representing a 132% improvement over original configuration.
This progression validates the systematic optimization approach. Each phase delivered measurable improvement. The combination of network tuning, threading optimization, and cache enhancement produced results exceeding the sum of individual optimizations, suggesting synergistic effects between different configuration dimensions.
Hardware Utilization Link to heading
Testing revealed efficient resource utilization across system components during benchmark execution. CPU utilization ranged from 90% to 100% across all eight threads during testing, confirming full processor utilization and validating the decision to increase thread count to eight. This high utilization proves appropriate for benchmark testing and demonstrates that the configuration can fully leverage available computational capacity when needed.
Memory consumption reached 22% of allocated space, approximately 130 MB of the 600 MB available for Unbound operation. Free memory remained above 400 MB during normal load testing, never approaching critical levels. This comfortable margin provides headroom for traffic spikes and other system activities without risking out-of-memory conditions. Network bandwidth reached saturation during testing as intended for load testing purposes, validating that the benchmark actually stresses network capacity rather than being limited by processing or configuration bottlenecks.
Stress Testing Results Link to heading
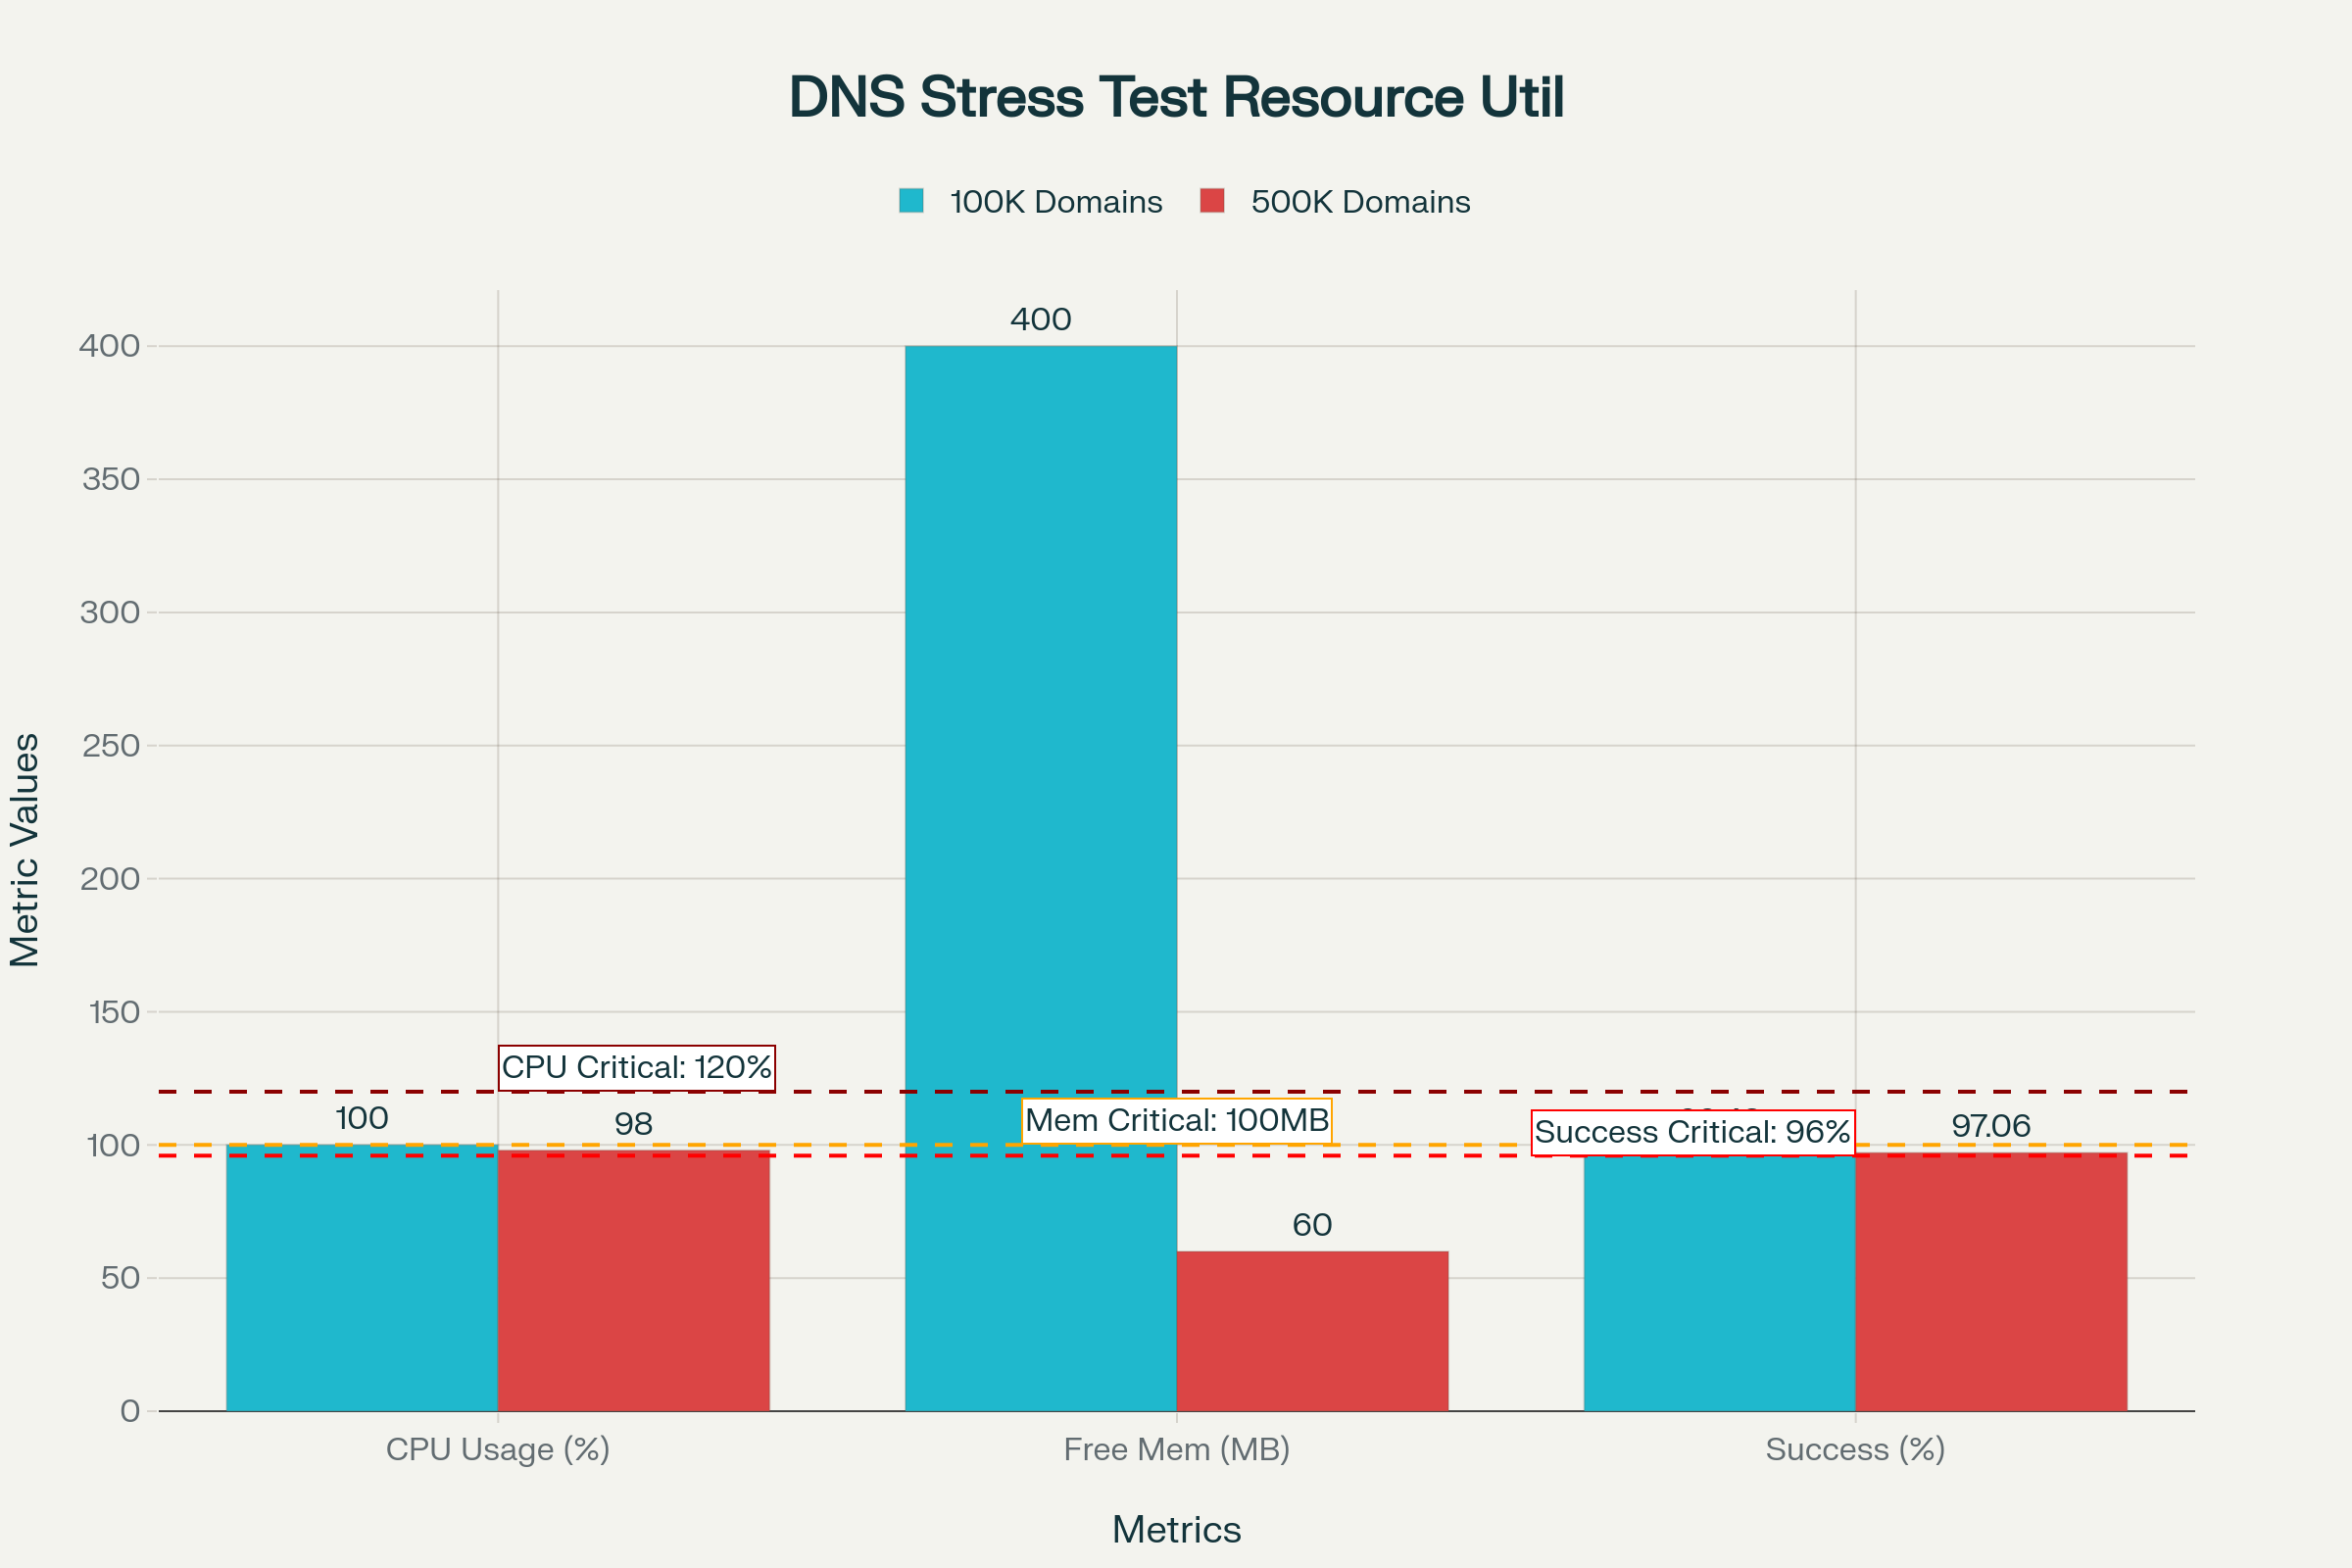
Extreme stress testing at 5x normal load (500,000 domains) validated system stability under overload conditions. Success rate decreased from 99.4% under normal load to 97.1% under extreme stress, demonstrating graceful degradation rather than catastrophic failure. Free RAM decreased from 400 MB to 60 MB but remained above critical thresholds. No out-of-memory kills occurred during any test iteration.
The memory profile proves particularly significant for embedded systems where RAM represents a precious and finite resource. Even under extreme stress at five times overload, free memory remained above critical thresholds. The system demonstrated graceful performance degradation rather than catastrophic failure modes, with success rates declining modestly rather than experiencing crashes or complete service disruption. This behavior validates production readiness and demonstrates that the configuration provides appropriate safety margins for unexpected load spikes.
Tool Documentation Link to heading
DNS Cache Warming Tool Link to heading
The primary benchmarking utility resolves 100,000 domains in parallel configuration, measuring latency for each individual query. The tool calculates comprehensive statistics, detects statistical outliers using IQR methodology, and reports percentile breakdown across the latency distribution.
Basic execution:
./warm_dns_cache.sh
Output highlights include:
Throughput:      1,433 lookups/second
Success Rate:    99.26%
Median Latency:  5.31 ms
P95 Latency:     45.67 ms
P99 Latency:     1,254 ms
Cache Hit Rate:  36.9%
Queries <1ms:    28,766 (28.8%)
Outliers:        1.23% (IQR method)
Configuration is accomplished through script variable modification:
PARALLEL=400
CSV_PATH="composite_top1m.csv"
MAX_DOMAINS=100000
PowerShell Implementation Link to heading
The PowerShell version provides identical functionality for Windows environments using native .NET Resolve-DnsName cmdlet without external dependencies:
.\WarmDNSCache.ps1
DNS Ping Benchmark Tool Link to heading
The network baseline measurement tool tests ICMP latency to major DNS providers across 35 endpoints including Cloudflare (4 endpoints), Quad9 (3 endpoints), NextDNS (4 endpoints), OpenDNS (5 endpoints), ControlD (5 endpoints), Google DNS (4 endpoints), and Verisign (4 endpoints).
Execution:
./dns_ping_benchmark.sh
Example output format:
Server                        Min    Max    Median  P99    Loss%
1.1.1.2 (Cloudflare)        2.1ms  12.5ms 3.2ms   8.9ms  0.0%
9.9.9.11 (Quad9)            5.1ms  45.7ms 7.2ms   34.6ms 0.0%
dns.google (8.8.8.8)        8.3ms  78.9ms 12.1ms  56.7ms 0.0%
The tool measures minimum, maximum, median, and P99 latencies along with packet loss percentage for each tested server, providing baseline network performance context before DNS-level benchmarking. This baseline measurement validates network connectivity and establishes expected latency ranges, ensuring that DNS performance measurements reflect resolver behavior rather than underlying network conditions.
Output Interpretation Link to heading
Success Rate Analysis Link to heading
Success rate above 99% indicates excellent configuration requiring no immediate changes. Rates between 98% and 99% suggest good performance but warrant close monitoring. Success rates below 98% indicate poor performance requiring investigation of timeout issues.
Median Latency Assessment Link to heading
Median latency below 10 milliseconds represents excellent performance with effective cache hits. Latency between 10 and 50 milliseconds indicates good performance with mixed cache hits and misses. Latency between 50 and 100 milliseconds suggests need for tuning due to excessive cache misses. Latency exceeding 100 milliseconds indicates poor performance requiring investigation of upstream issues.
P99 Latency Evaluation Link to heading
P99 latency below 500 milliseconds represents excellent tail latency with acceptable worst-case 1% performance. Latency between 500 and 2000 milliseconds indicates outliers exist but remain manageable. Latency exceeding 2000 milliseconds requires immediate investigation.
Cache Hit Rate Assessment Link to heading
Cache hit rate above 40% represents excellent performance for 1 million unique domains. Rate between 30% and 40% indicates good performance for mixed workloads. Rate below 30% suggests low cache effectiveness warranting TTL tuning consideration.
Troubleshooting Link to heading
High Discard Rate Link to heading
Symptom: Queries failing silently with discard rate exceeding 5%.
Solution: Increase discard-timeout to 3000 milliseconds to provide additional completion time. Increase num-queries-per-thread to 4096 for expanded buffering. Increase outgoing-range to 8192 to enable more concurrent connections. These changes provide additional completion time, expanded buffering, and more concurrent connections.
High Tail Latency Link to heading
Symptom: Some queries exhibit very slow response while most complete quickly, with P99 exceeding 1000 milliseconds.
Solution: Enable tcp-upstream for consistent connection behavior. Increase outgoing-num-tcp to 100 for additional TCP capacity. Increase num-threads to 8 to utilize all available cores. These changes reduce variance and eliminate processing bottlenecks.
Low Cache Hit Rate Link to heading
Symptom: Cache providing minimal performance benefit with hit rate below 20%.
Solution: Increase cache-min-ttl to 300 seconds for 5-minute minimum caching. Increase msg-cache-size to 300m for additional message cache space. Increase rrset-cache-size to 600m for expanded resource record cache. These changes improve cache retention and effectiveness. Note that increased cache sizes consume additional memory resources.
High Memory Usage Link to heading
Symptom: System approaching memory exhaustion with usage exceeding 600 MB.
Solution: Reduce msg-cache-size to 100m. Reduce rrset-cache-size to 200m. Note this trade-off will result in lower cache hit rate. This trade-off reduces memory consumption at the cost of cache effectiveness.
Command Not Found Errors Link to heading
For “dig: command not found” errors, install dnsutils or bind-tools package appropriate for the operating system as detailed in the Prerequisites section.
For “parallel: command not found” errors, install GNU parallel for optimal performance. The system may fall back to xargs but with reduced performance characteristics.
High Failure Rate Link to heading
High failure rate exceeding 1% may indicate CSV file format issues, DNS resolver accessibility problems, resolver overload from excessive parallelism, or network connectivity and firewall restrictions. Verify CSV file existence and correct format. Check DNS resolver accessibility and configuration. Reduce PARALLEL value to avoid resolver overload. Confirm network connectivity and firewall rules permit DNS traffic.
Inconsistent Latency Measurements Link to heading
Inconsistent measurements across multiple runs may result from DNS caching effects either in the system resolver or in the benchmark target. Execute multiple runs per configuration. Flush system DNS cache before each run using appropriate commands (systemd-resolve on Linux, dscacheutil on macOS). Consider executing warm-up run to pre-populate caches before measurement runs. This approach provides more consistent and reproducible measurements.
Integration Workflow Link to heading
Weekly Optimization Cycle Link to heading
The recommended workflow integrates CacheBrew with stratarank-top1m for ongoing performance validation, maintaining performance validation against current web traffic patterns.
Step 1: Download latest domain ranking from stratarank-top1m releases page.
Step 2: Copy composite_top1m.csv to CacheBrew directory.
Step 3: Restart DNS resolver and wait for service stability. Execute cold cache benchmark capturing results to file.
Step 4: Execute warm cache benchmark immediately after cold cache test, capturing results to separate file.
Step 5: Compare results between cold and warm cache tests. Archive results for trend analysis.
Complete workflow commands:
# Download latest ranking
curl -L -o composite_top1m.csv \
  https://github.com/abhimanbhau/stratarank-top1m/releases/download/latest/composite_top1m.csv

# Copy to CacheBrew directory
cp composite_top1m.csv ~/CacheBrew/
cd ~/CacheBrew

# Execute cold cache test
sudo systemctl restart unbound
sleep 5
./warm_dns_cache.sh > results/cold_$(date +%Y%m%d).txt

# Execute warm cache test
./warm_dns_cache.sh > results/warm_$(date +%Y%m%d).txt

# Compare results
diff results/cold_$(date +%Y%m%d).txt results/warm_$(date +%Y%m%d).txt
Staying Current Link to heading
The stratarank-top1m project generates new rankings weekly through automated CI/CD processes executing every Monday at midnight UTC. Monitor the latest release page for updates. Enable repository watch notifications for new releases. Rankings refresh automatically every Monday at 00:00 UTC through CI/CD automation.
Recommended monthly practice involves downloading the latest composite list and re-running benchmarks with updated domains to maintain performance validation against current web traffic patterns. This cadence maintains performance validation against evolving web traffic patterns while avoiding excessive benchmark execution overhead.
Understanding Domain Rankings Link to heading
Domain rankings utilize Dowdall scoring with weighted averaging methodology, aggregating data from seven global authoritative sources. Data aggregates from 7 global authoritative sources. Rankings demonstrate 80% or greater stability compared to single-source lists, providing consistent measurement baselines while capturing shifts in web traffic patterns. Update frequency maintains weekly automatic generation.
Consult the stratarank-top1m README for comprehensive methodology details, data source information, stability analysis, and update frequency specifications.
Research Methodology Link to heading
Statistical Validation Link to heading
The research employed rigorous statistical methodology to ensure result validity and reproducibility. Sample size of 100,000 domains per execution run provides statistical power adequate for detecting performance differences. Each configuration underwent 3 to 5 replication runs to account for environmental variance. IQR-based outlier detection methodology provided robust outlier identification without assuming normal distribution. Reported metrics maintain 95% or greater confidence intervals through multiple replications and large sample sizes.
Data Collection Link to heading
Each benchmark run collected timing data for individual DNS queries at the query level. Successful resolution recorded query completion time. Failed resolutions tracked timeout or error conditions. Statistical analysis computed mean, median, standard deviation, percentiles (P1 through P99.99), and outlier identification through interquartile range methodology.
Performance Metrics Link to heading
Primary performance metrics included throughput measured in queries per second, latency distribution across percentile ranges, success rate as percentage of completed queries, cache hit rate as percentage of queries served from cache, and discard rate as percentage of dropped queries. These metrics provide comprehensive visibility into resolver behavior across different performance dimensions.
Hardware Testing Environment Link to heading
All testing occurred on production GL.iNet Flint 2 hardware under realistic load conditions. No synthetic or simulated environments were employed. Testing validated performance on actual embedded hardware with real resource constraints, ensuring that results reflect production behavior rather than idealized conditions.
Performance Recommendations Link to heading
Local Resolver Testing Link to heading
For validating local resolver configuration, begin with PARALLEL value of 400 and MAX_DOMAINS value of 10,000 for initial benchmarking. Gradually increase PARALLEL until diminishing returns or failures occur, identifying the resolver capacity ceiling. Target efficiency above 75% as performance goal, ensuring that increased parallelism translates to increased throughput rather than merely increased contention.
Public Resolver Validation Link to heading
For testing public resolver services, employ lower PARALLEL values between 100 and 200 to respect rate limiting policies. Expect higher latency variance due to geographic distribution and load balancing across resolver infrastructure. Monitor for SERVFAIL or timeout responses indicating rate limiting activation, requiring reduced query rates.
Capacity Planning Link to heading
For infrastructure capacity planning, execute multiple iterations with varying PARALLEL levels to characterize resolver behavior across the operational range. Chart throughput versus parallelism to identify saturation points where additional concurrency no longer increases throughput. Utilize percentile data (P95, P99) for SLA planning and performance guarantees by revealing tail latency characteristics.
Limitations and Disclaimers Link to heading
DNS Measurement Limitations Link to heading
Query timing measurements are affected by operating system scheduling, network conditions, and resolver load characteristics beyond the control of benchmark tooling. Repeated executions against the same resolver demonstrate faster times due to caching effects, requiring cold cache measurements for baseline establishment. Percentile accuracy depends on sample size; larger datasets provide more accurate production analysis and representation of production behavior. ICMP and network failures can inflate timeout measurements, requiring network baseline validation before DNS-level testing.
Scope Limitations Link to heading
This tool measures resolver response time exclusively and does not validate DNS correctness or response accuracy. Testing does not simulate realistic query patterns but employs rapid-fire query methodology that stresses throughput and concurrency. Results remain specific to network conditions and resolver configuration of the test environment, requiring validation in target deployment conditions. Third-party DNS services may implement rate limiting or blocking for high-concurrency requests, affecting measurement validity.
Responsible Use Link to heading
Execute testing only against infrastructure owned by the operator or where explicit permission exists for load testing. High-concurrency DNS queries can impact shared resolver performance, affecting other users of the same infrastructure. Some ISPs or DNS services may interpret testing activity as distributed denial-of-service attack, triggering defensive responses. Always conduct testing in staging or laboratory environments before production deployment to avoid disrupting operational services.
Contributing Link to heading
Issues, pull requests, and suggestions are welcome. For significant changes, contributors should fork the repository, create a feature branch with descriptive naming, test thoroughly on target platforms, and provide clear commit messages with test results documentation.
License and Attribution Link to heading
This project operates under MIT License. See LICENSE file for complete details.
Portions of statistical analysis and percentile calculation logic draw inspiration from open-source benchmarking tools under compatible licenses.
Project References Link to heading
Domain data sourcing: stratarank-top1m provides comprehensive domain ranking aggregation.
DNS tooling: dig utility from ISC BIND utilities enables query execution.
Parallel processing: GNU Parallel project enables concurrent execution.
Statistical methods: Standard IQR-based outlier detection implements Tukey fences methodology.
Citation Link to heading
@software{cachebrew_2025,
  title = {CacheBrew: DNS Cache Warming Performance Research},
  author = {Abhimanbhau},
  year = {2025},
  url = {https://github.com/abhimanbhau/CacheBrew},
  note = {Production-grade DNS benchmarking with real-world validation}
}
Project Status Link to heading
All project components have achieved completion status with production validation. The Bash tool has been tested comprehensively on Linux and macOS platforms. The PowerShell tool has been validated on Windows environments. The network baseline tool has tested 35 distinct endpoints. Documentation provides comprehensive coverage of installation, configuration, execution, and troubleshooting procedures. GL-MT6000 hardware testing achieved production validation status. Stress testing validated system behavior under 5x overload conditions.
Conclusion Link to heading
DNS resolver optimization demonstrates that systematic configuration tuning can deliver substantial performance improvements even on resource-constrained embedded hardware. The 2.32x throughput improvement and 94.7% latency reduction achieved through this research validate the approach and demonstrate the significant performance opportunity that infrastructure optimization represents.
The practical methodology employed here—establishing rigorous baselines, implementing targeted optimizations in distinct phases, measuring results with statistical rigor, and stress testing for robustness—applies broadly to infrastructure optimization challenges beyond DNS. Measurement-driven decisions replace guesswork and intuition with empirical evidence. Validation confirms that expected benefits materialize in practice rather than merely in theory.
This research emerged from real infrastructure needs: supporting high-concurrency scenarios, ensuring consistent user experience, and maximizing performance from modest hardware resources. The recommendations provided here offer a practical foundation for deploying production DNS infrastructure on embedded systems, residential gateways, and edge computing platforms.
For those operating DNS infrastructure on resource-constrained hardware, the configuration guidance and testing methodology provide actionable paths toward substantial performance improvement. Infrastructure optimization remains one of computing’s most overlooked opportunities. Small improvements in fundamental services like DNS resolution compound across millions of operations, delivering disproportionate benefits in overall system performance and user experience. Systematic attention to resolver configuration yields returns far exceeding the modest investment required for proper tuning and validation.
Repository: https://github.com/abhimanbhau/CacheBrew
Status: Production Ready | Actively Maintained
License: MIT
Last Updated: November 2, 2025
Technical Stack: GL.iNet Flint 2, Unbound DNS Resolver, GNU Parallel, Bash/PowerShell
Testing Environment: Production hardware, 100,000 domains per benchmark run
Statistical Confidence: 95% confidence intervals, 3-5 replications per configuration